It’s hard to know what to cover in this objective as performance tuning often implies troubleshooting (note the recommended reading of Performance Troubleshooting!) hence there’s a significant overlap with the troubleshooting section. Luckily there are plenty of excellent resources in the blogosphere and from VMware so it’s just a case of reading and practicing.
Knowledge
- Identify appropriate BIOS and firmware setting requirements for optimal ESX/ESXi Host performance
- Identify appropriate ESX driver revisions required for optimal ESX/ESXi Host performance
- Recall where to locate information resources to verify compliance with VMware and third party vendor best practices
Skills and Abilities
- Tune ESX/ESXi Host and Virtual Machine memory configurations
- Tune ESX/ESXi Host and Virtual Machine networking configurations
- Tune ESX/ESXi Host and Virtual Machine CPU configurations
- Tune ESX/ESXi Host and Virtual Machine storage configurations
- Configure and apply advanced ESX/ESXi Host attributes
- Configure and apply advanced Virtual Machine attributes
- Tune and optimize NUMA controls
Tools & learning resources
- Product Documentation
- vSphere Client
- Performance Graphs
- vSphere CLI
- vicfg-*,resxtop/esxtop, vscsiStats
- VMworld 2010 session TA7750 Understanding Virtualisation Memory Management (subscription required)
- VMworld 2010 session TA7171 – Performance Best Practices for vSphere (subscription required)
- VMworld 2010 session TA8129 – Beginners guide to performance management on vSphere (subscription required)
- Performance Troubleshooting in Virtual Infrastructure (TA3324, VMworld ’09)
- Scott Sauer’s blogpost on storage performance
- VMware’s Performance Best Practices white paper
Identify BIOS and firmware settings for optimal performance
This will vary for each vendor but typical things to check;
- Power saving for the CPU.
- Hyperthreading – should be enabled
- Hardware virtualisation (Intel VT, EPT etc) – required for EVC, Fault Tolerance etc
NOTE: You should also enable the ‘No Execute’ memory protection bit. - NUMA settings (node interleaving for DL385 for instance. Normally disabled – check Frank Denneman’s post.
- WOL for NIC cards (used with DPM)
Identify appropriate ESX driver revisions required for optimal host performance
I guess they mean the HCL. Let’s hope you don’t need an encyclopaedic knowledge of driver version histories!
Tune ESX/i host and VM memory configurations
Read this great series of blog posts from Arnim Van Lieshout on memory management – part one, two and three. And as always the Frank Denneman post.
Check your Service Console memory usage using esxtop.
Hardware assisted memory virtualisation
Check this is enabled (per VM). Edit Settings -> Options -> CPU/MMU Virtualisation;
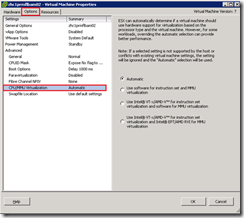
NOTE: VMware strongly recommend you use large pages in conjunction with hardware assisted memory virtualisation. See section 3.2 for details on enabling large memory pages. However enabling large memory pages will negate the efficiency of TPS so you gain performance at the cost of higher memory usage. Pick your poison…(and read this interesting thread on the VMware forums)
Preference for memory overcommit storage performance (most effective at the top);
- Transparent page sharing (negligible performance impact)
- Ballooning
- Memory compression
- VMkernel swap files (significant performance impact)
Transparent Page Sharing (TPS) – otherwise known as memory dedupe!
- Enabled by default
- Refreshed periodically
- Can be disabled;
- Disable per ESX – add Mem.ShareScanGHz = 0 in Advanced Settings (VMwareKB1004901)
- Disable per VM – add sched.mem.pshare.enable = FALSE in .VMX (entry not present by default).
- Efficiency is impacted If you enable large memory pages (see this discussion)
Balloon driver
- Uses a guest OS driver (vmmemctl) which is installed with VMware Tools (all supported OSs)
- Guest OS must have enough swapfile configured for balloon driver to work effectively
- Default max for balloon driver to reclaim is 65%. Can be tuned using sched.mem.maxmemctl in .VMX (entry not present by default). Read this blogpost before considering disabling!
- Ballooning is normal when overcommitting memory and may impact performance
Swapfiles
- VMware swapfiles
- Stored (by default) in same datastore as VM (as a .vswp file). Size = configured memory – memory reservation.
- Include in storage capacity sizing
- Can be configured to use local datastore but that can impact vMotion performance. Configured at either cluster/host level or override per VM (Edit Settings -> Options – Swapfile location)
- Will almost certainly impact performance
- Guest OS swapfiles
- Should be configured for worst case (VM pages all memory to guest swapfile) when ballooning is used
NOTE: While both are classified as ‘memory optimisations’ they both impact storage capacity.
Memory compression
Memory compression is a new feature to vSphere 4.1 (which isn’t covered in the lab yet) so I won’t cover it here.
Monitoring memory optimisations
TPS
- esxtop;
- PSHARE/MB – check ‘shared’, ‘common’ and ‘savings’ (memory overcommit)
- Overcommit % shown on the top line of the memory view (press m). 0.19 = 19%.
- NOTE: On Xeon 5500 (Nehalem) hosts TPS won’t show much benefit until you overcommit memory (VMwareKB1021095)
- vCenter performance charts (under ‘Memory’);
- ‘Memory shared’. For VMs and hosts, collection level 2.
- ‘Memory common’. For hosts only, collection level 2
Ballooning
- esxtop
- MEMCTL/MB – check current, target.
MCTL? to see if driver is active (press ‘f’ then ‘i’ to add memctl columns)
- MEMCTL/MB – check current, target.
- vCenter performance charts (under ‘Memory’);;
- ‘memory balloon’. For hosts and VMs, collection level 1.
- ‘memory balloon target’. For VMs only, collection level 2.
Swapfiles
- esxtop
- SWAP/MB – check current, r/s, w/s.
- SWCUR to see current swap in MB (press ‘f’ then ‘j’ to add swap columns)
- vCenter performance charts (under ‘Memory’);
- ‘Memory Swap Used’ (hosts) or ‘Swapped’ (VMs). Collection level 2.
- ‘Swap in rate’, ‘Swap out rate’. For hosts and VMs, collection level 1.
NOTE: Remember you can tailor statistics levels – vCenter Server Settings -> Statistics. Default is all level one metrics kept for one year.
Read Duncan Eppings blogpost for some interesting points on using esxtop to monitor ballooning and swapping. See Troubleshooting section 6.46.2 for more information on CPU/memory performance.
Tune ESX/ESXi Host and Virtual Machine networking configurations
Things to consider;
- Check you’re using the latest NIC driver both for the ESX host and the guest OS (VMTools installed and VMXNET3 driver where possible)
- Check NIC teaming is correctly configured
- Check physical NIC properties – speed and duplex are correct, enable TOE if possible
- Add physical NICs to increase bandwidth
- Enable Netqueue – see section 2.1.3
- Consider DirectPath I/O – see section 1.1.4
- Consider use of jumbo frames (though some studies show little performance improvement)
Monitoring network optimisations
esxtop (press ‘n’ to get network statistics);
- %DRPTX – should be 0
- %DRPRX – should be 0
- You can also see which VM is using which pNIC in a team (assuming it’s using virtual port ID load balancing), pNIC speed and duplex
vCenter (Performance -> Advanced -> ‘Network’);
- Network usage average (KB/s). VMs and hosts, collection level 2.
- Dropped rx – should be 0, collection level 2
- Dropped tx – should be 0, collection level 2
See Troubleshooting section 6.3 for more information on networking performance.
Tune ESX/ESXi Host and Virtual Machine CPU configurations
Hyperthreading
- Enable hyperthreading in the BIOS (it’s enabled by default in ESX)
- Set hyperthreading sharing options on a per VM basis (Edit Settings -> Options). Default is to allow sharing with other VMs and shouldn’t be changed unless specific conditions require it (cache thrashing).
- Can’t enable with more than 32 cores (ESX has a 64 logical CPU limit)
CPU affinity
- Avoid where possible – impacts DRS, vMotion, NUMA, CPU scheduler efficiency
- Consider hyperthreading – don’t set two VMs to use CPU 0 & 1 as that http://premier-pharmacy.com/product/lamictal/ might be a single hyperthreaded core
- Use cases – licencing, copy protection
CPU power management (vSphere v4.1 only)
- Enabled in BIOS and ESX
- Four levels;
- High performance (default) – no power management features evoked unless triggered by thermal or power capping events
- Balanced
- Low power
- Custom
NOTE: VMware recommend disabling CPU power management in the BIOS if performance concerns outweigh power saving.
Monitoring CPU optimisations
esxtop (press ‘c’ to get CPU statistics);
- CPU load average (top line) – for example 0.19 = 19%.
- %PCPU – should not be 100%! If one PCPU is constantly higher than other check for VM CPU affinity
- %RDY – should be below 10%
- %MLMTD – should be zero. If not check for VM CPU limits.
- You can also use ‘e’ to expand a specific VM and see the load on each vCPU. Good to check if vSMP is working effectively.
vCenter (Performance -> Advanced -> ‘CPU’);
- ‘%CPU usage’ – for both VMs and hosts, collection level 1
- ‘CPU Ready’ – for VMs only, collection level 1. Not a percentage like esxtop – see this blog entry about converting vCenter metrics into something meaningful.
See Troubleshooting section 6.2 for more information on CPU/memory performance.
Tune ESX/ESXi Host and Virtual Machine storage configurations
In reality there’s not that much tuning you can do at the VMware level to improve storage, most tuning needs to be done at the storage array (reiterated in the ESXTOP Statistics guide).So what can you tune? Watch VMworld 2010 session TA8065 (subscription required).
Multipathing – select the right policy for your array (check with your vendor);
- MRU (active passive)
- Fixed (active/active)
- Fixed_AP (active/passive and ALUA)
- RR (active/active, typically with ALUA)
Check multipathing configuration using esxcli and vicfg-mpath. For iSCSI check the software port binding.
Storage alignment
You should always align storage at array, VMFS, and guest OS level.
Storage related queues
Use esxcfg-module to amend LUN (HBA) queue depth (default 32). Syntax varies per vendor.
Use esxcfg-advcfg to amend VMkernel queue depth. Should be the same as the LUN queue depth.
NOTE: If you adjust the LUN queue you have to adjust on every host in a cluster (it’s a per host setting)
Using vscsiStats
See section 3.5 for details of using vscsiStats.
NOTE: Prior to vSphere 4.1 (which includes NFS latency in both vCenter charts and esxtop) vscsiStats was the only VMware tool to see NFS performance issues. Use array based tools!
Monitoring storage optimisations
esxtop (press ‘d’,’u’, or ‘v’ to get storage metrics for HBA, LUN and per VM respectively);
- KAVG/cmd should be less than 2 (delay while kernel empties storage queue)
- DAVG/cmd should be under 15-20ms (approx)
- ABRTS/s should be zero (this equates to guest OS SCSI timeouts)
- CONS/s should be zero (SCSI reservation conflicts. May indicate too many VMs in a LUN). v4.1 only.
vCenter (Performance -> Advanced -> Disk (or Datastore). Only available in vSphere 4.1)
- Read latency – collection level 2
- Write latency – collection level 2
- Disk command aborts – if greater than 1 indicates overloaded storage. V4.1 only.
Generic tips for optimising storage performance
- Check IOps
- Check latency
- Check bandwidth
- Remember for iSCSI and NAS you may also have to check network performance
See Troubleshooting section 6.4 for more information on storage performance.
Configure and apply advanced ESX/ESXi Host attributes
These can be configured via Configuration -> Advanced Settings. Things you’ll have used this for;
- Checking if Netqueue is enabled/disabled (vmKernel -> Boot)
- Updating your NFS settings to apply Netapp recommendations (if you use Netapp storage)
- Allowing snapshots on a virtual ESX host in your lab (unsupported but very useful!)
- Disabling transparent page sharing
- Setting preferred AD controllers (when using AD integration in vSphere 4.1)
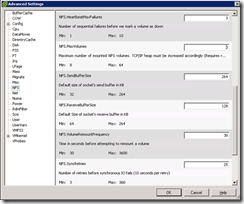
Configure and apply advanced Virtual Machine attributes
These are configured on a per VM basis via Edit Settings -> Options -> General -> Configuration Parameters. Things you’ll use this at VMware support’s recommendation;
- Disabling alerts about a missing SCSI driver (courtesy of this blogpost)
- Enabling Fault Tolerance on a virtual ESX host for your lab (not that this worked for me)
- Enabling nested VMs to run on a virtual ESX host
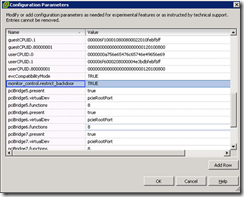
Tune and optimize NUMA controls
Non Uniform Memory access (NUMA) is a technology designed to optimise motherboard design. Rather than provide a single pool of physical memory to the various CPUs each CPU is given a set of ‘local’ memory which is can access very quickly. The disadvantage is that not all memory is instantly accessible to all CPUs. Read VMware vSphere™ : The CPU Scheduler in VMware® ESX™ 4.1 for more info.
If you want to understand NUMA, you need to check out Frank Denneman’s site. As of March 2011 he’s got 11 in-depth articles about NUMA.
Practical implications for VCAP-DCA exam?
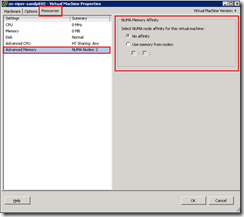
- Configured per VM. Go to Edit Settings -> Resources tab -> Advanced CPU.
- Can have a performance impact if not balancing properly
- Can be monitored using esxtop (Frank Denneman’s post shows how)
- Setting CPU affinity breaks NUMA optimisations
Configure CPU and memory NUMA affinity;
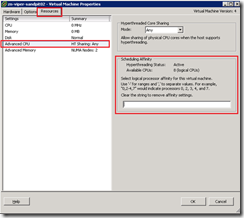
Monitoring performance impact of NUMA
Using esxtop go to the memory view (m). The first figure is the total memory per NUMA node (approx. 20GB in the screenshot below) and the figure in brackets is the memory free per node. To get more NUMA related statistics press ‘f’ (to select fields to add) and then ‘g’ for NUMA statistics.
< ![endif]–>
Monitoring performance impact of NUMA
Using esxtop go to the memory view (m). The first figure is the total memory per NUMA node (approx. 20GB in the screenshot below) and the figure in brackets is the memory free per node. To get more NUMA related statistics press ‘f’ (to select fields to add) and then ‘g’ for NUMA statistics.
DIAGRAM
As you can see this server in this example is very imbalanced which could point to performance issues (it’s a 4.0u1 server so no ‘wide NUMA’). Looking further you can see that zhc1unodb01 only has 54% memory locality which is not good (Duncan Epping suggests under 80% is worth worrying about). Other people have seen similar situations and VMwareKB1026063 is close but doesn’t perfectly match my symptoms. vSphere 4.1 has improvements using ‘wide’ NUMA support – maybe that’ll help…
o Should be configured for worst case (VM pages all memory to guest swapfile) when ballooning is used
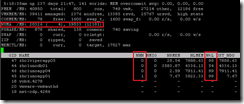
As you can see this server in this example is very imbalanced which could point to performance issues (it’s a 4.0u1 server so no ‘wide NUMA’). Looking further you can see that zhc1unodb01 only has 54% memory locality which is not good (Duncan Epping suggests under 80% is worth worrying about). Other people have seen similar situations and VMwareKB1026063 is close but doesn’t perfectly match my symptoms. vSphere 4.1 has improvements using ‘wide’ NUMA support – maybe that’ll help…

One thought on “VCAP-DCA Study notes – 3.1 Tune and Optimize vSphere Performance”